
Can Zohran Mamdani Fix New York's Problems? Foreign Case Studies Bravely Say 'Maybe'.
We compared Mayor-Elect Mamdani's discounted/free public fares and rent control proposals to the effects and implementation of similar policies in Dublin and Budapest.


Zohran Mamdani won the New York mayoral election on the back of progressive policies, such as fare-free buses, rent freeze (which is not unprecedented) and in tandem with the latter investing into increasing supply by building subsidized housing. Of course, questions can be raised: how feasible are these policies, and what practical effects might they have, regardless of intent? While the first question would probably require an evaluation of NY budget and state/federal contributions, mayoral powers and Rent Guidelines Board collaboration, so we’ll instead focus on comparing them to similar policies enacted elsewhere. As he’s not inaugurated yet, we’ll obviously only evaluate his campaign talking points and their feasibility.
Ireland Rent Pressure Zones: Rent Control Without Freeze
Since 2016 Ireland introduced rent control, though not rent freeze, in selected areas of the country, and from 2025 Rent Pressure Zones - where this policy is in effect - were extended to the entirety of Ireland.
Background
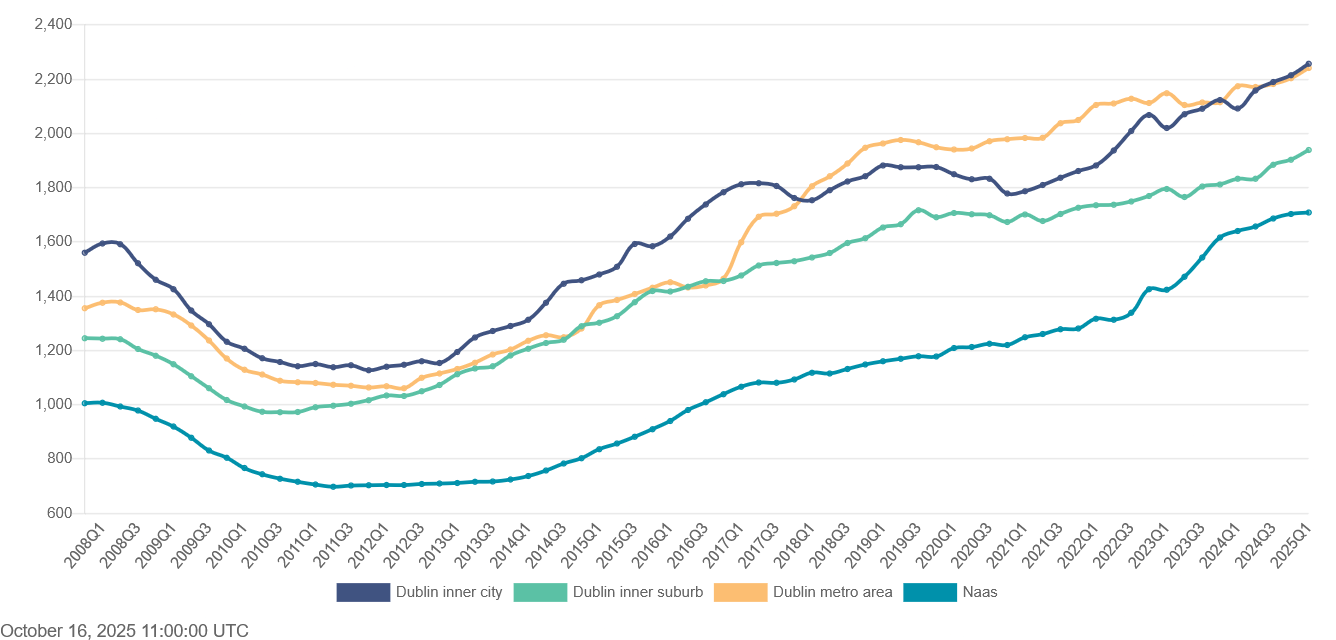
In a nutshell, in the early 2000s the Irish economy became over-reliant on its construction industry. Housing prices increased through the roof in the late 90s; followed by tax relief and incentives granted leading to a dramatic increase of housing supply (read more in the Rural Renewal Plan). At its height in the mid 2000s, 12% of the country’s workforce was employed in the construction sector. By 2007, rent prices started to fall, continuing into 2008 (see below) to yields as low as ~3% - comparably renting yields are around ~7% in 2024 and 2025. Demand for property started to decline by 2007, then the bubble burst by 2008-2009 and rent prices fell by ~25% (see below, ~1600EUR in Dublin 16 fell to ~1200EUR by 2010).
As the property market and the construction industry crashed, supply started to decline and as such rent started to ‘bounce back’ as well - noted as early as 2014.
The RPZs
Originally introduced in 2016, a few years after rent prices started their sharp hike up. These were designated areas where rents could not be increased by more than general inflation, or 2% if inflation was higher. A criterion for the designation was that rent increases in the area must have been more than 7% annually in at least 4 of the last 6 quarters. As noted in the 2014 article linked above, that was already the countrywide average, with Dublin providing the brunt of it - see the 3 Dublin areas on the figure below.
Since 2025, all of Ireland is an RPZ, which means rent control rules essentially following the guidelines above.
Between 2016 Q1 and 2017 Q1 rent prices in inner Dublin (Donnybrook in our example) increased by 11%; and by more that 5% in Q1 2021 Q1 and 2022 Q1.
In Naas, a commutable distance city outside of the Dublin metro area (designated RPZ since 2017), where rent prices increased 8% from 22 to 23, and then by another 15% from 23 to 24.
There are of course exceptions when prices can exceed the RPZ rules, such as longer periods of not being rented or substantial changes (such as extensions or large scale renovations) and new building without a history of previous rent prices to be controlled, which could account for some of the periods of steeper increases.
Naas could also be explained by the general trend of moving away from larger cities for ( sometimes theoretically) cheaper housing.
All in all, while it seems like the policy is not ironclad, despite some spikes I’d still deem it successful in flattening - or even breaking - the pattern of consistent increases in rent prices at least compared to the yearly 7% average increase before. Some trends and effects on the housing market ultimately can’t be frozen or controlled completely and when looking at data such as rent prices here, other factors (like exceptions and new supply) must also be taken into account.
Hungary Housing Market: Subsidized Loans
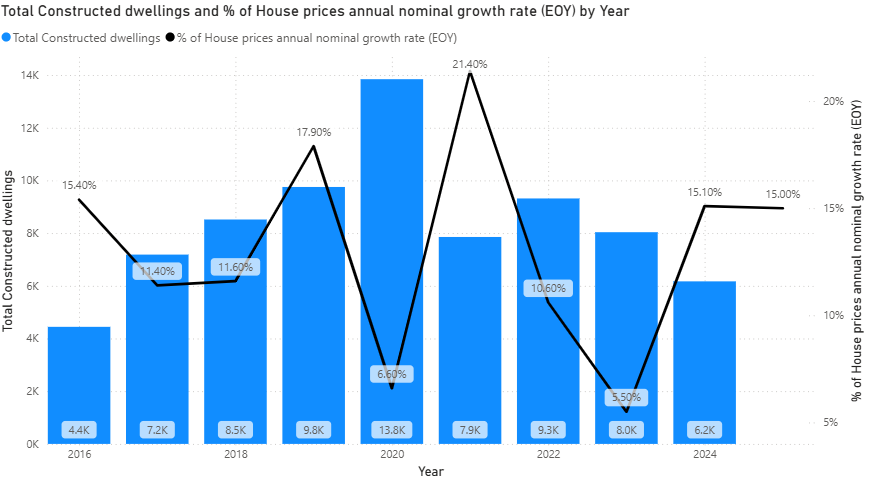
Hungary has multiple types of subsidized loans and mortgages introduced over the years. The first one currently available was introduced in 2015 theoretically to support new families based on the number of new children planned (past children do not count) - sadly data is not available for 2015 but based on later data, a price growth rate of 15% is still considered high comparatively.
One of the latest of such was launched in 2019 summer. This loan grants families who promise to have children a maximum of 10 million HUF (~25k EUR) loan with subsidized repayment conditions (assuming they actually follow through otherwise the subsidies must be repaid). The loans started taking effect in Q4 2019 and we can see the increase in price growth EoY despite increase supply compared to 2018.
The most recent loan option is about lowered interest rates for first time homeowners and while 2025 data is not fully available yet, we can see another sharp increase rate for price growth. The construction of new dwellings also decreased, but I imagine it will start to increase a bit going forward as buyer intent rises. Based on historical trends supply will likely also increase going forward.
There are some other longish running programs and shorter bursts of subsidies but these are the most relevant.
Other things I have to call out:
the latest price growth rate (at least) is not just alarming in terms of local currency context as according to the Hungarian National Bank (the primary data source for this item) is “an outstanding rate even by European Union standards”
the rates displayed are country-wide, so the 2021 deep-Covid price growth record was also driven by the spike in countryside property, not the capital itself which only saw a 12% increase (in the Nat. Bank’s words “This was primarily due to the outstanding price increase in the countryside”). A personal side note is that home office work became the standard (during those years) which is why a lot of people took the opportunity of moving away from the capital.
I also acknowledge that there are other factors in play as well, such as inflation, but that was only 5% officially (though the Hungarian CSO has a tendency to skew data a bit), and growth on the housing market eclipses that number. That leads me to believe that people see property more and more as an inflation proof investment- though that would require a dedicated analysis.
My reading of programs such as subsidies making housing more affordable is that if the supply side is left to the private sector, the subsidies will just be built in the sale values by the private sector without moving the affordability meter much - I could go as far as saying these are, in a way, often subsidies for the sellers, not the buyers (not going into it in details but the HNB also measures overvaluation of housing properties in the summaries, linked in the chart caption below). This is not to say that it’s completely ineffective, done right I imagine it can reach positive results but based on this case study, it needs to be planned and executed with a lot of care and oversight. Ideally construction and ownership of new dwellings being party handled by the government introducing the policy so prices can be first-party controlled.
Budapest Public Transport: Discounted and Free Passes
The full-price adult monthly pass provided by the Budapest Public Transport Service (BKK) costs 9k HUF. Taking the national average net wages of 470k HUF in the business sector (not published separately for Budapest, as per CSO Hungary), making it an already inexpensive way of commuting in the city. The passes with the usual discount for students, pensioners cost 3,5k HUF, about a third of that amount.
Since 2019 there are new discounted tickets:
parents with small children only need to buy a student-price pass, down from a previous full pass price
children under the age of 14 travel for free, down from the previous student pass
These are considerable price subsidies as a lot of commuters in the city primarily use public transport, and metro area car-using families also often leave their vehicles in parking lots somewhere in the city or around its limits switching to public transport options.
Standard single ticket prices were also frozen for a long time without increasing with inflation.
A recent (since 2021) change is free passes being offered for children under the age of 14; and because of a competition between the state railway and the BKK, recent tariff changes included the a decrease in price of the monthly Budapest passes from 10k to 9k (rounded). This competition also resulted in a complex web of intertwined revenues with BKK and state railway passes being purchasable through each other’s services and as such both gaining a portion of the profits of their passes bought on the other’s platform.
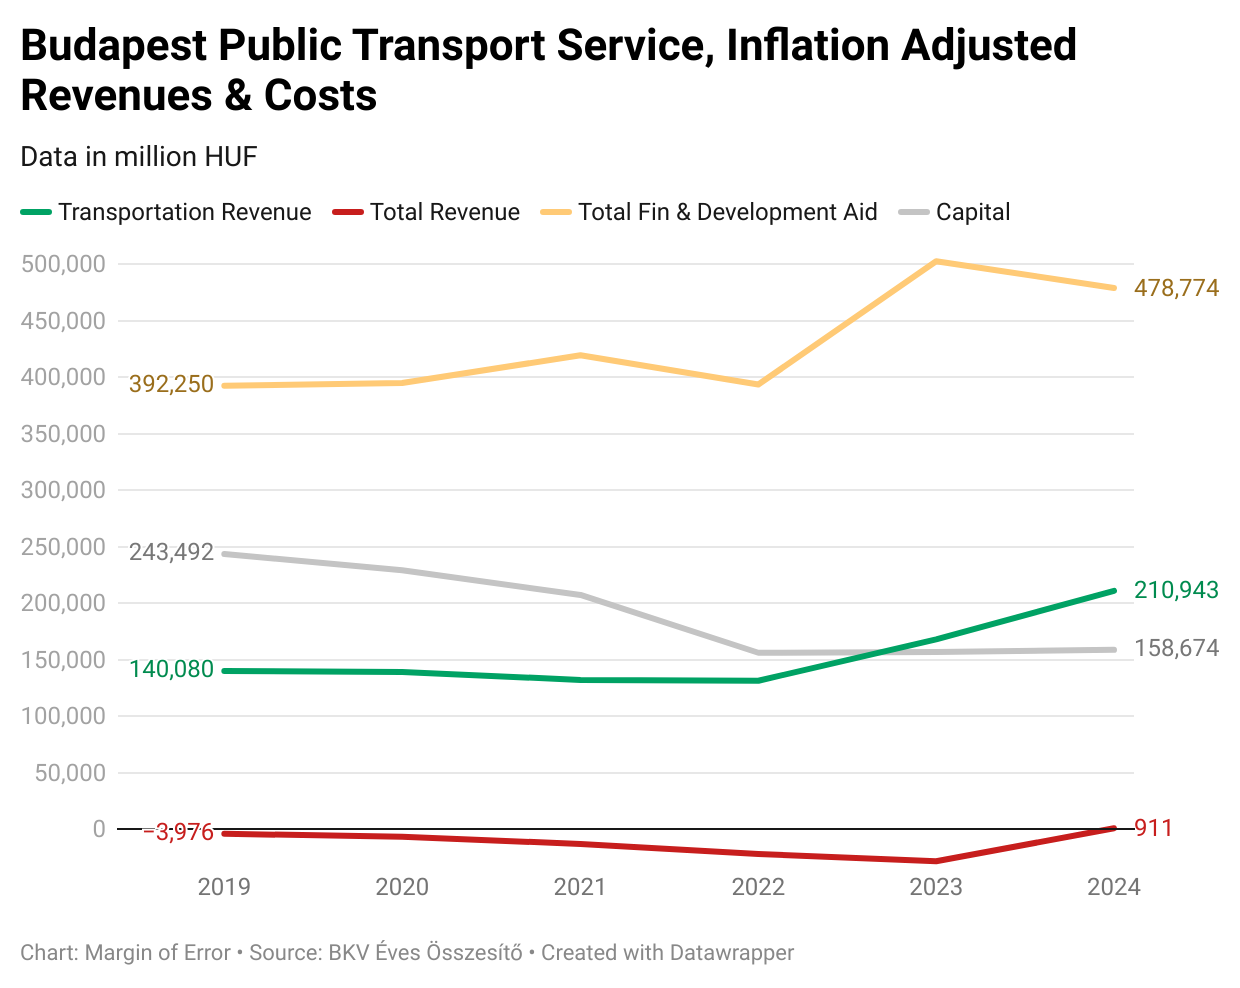
Anyway, while service is not free of course, these were significant shifts in pricing, reducing revenue of the holding company. Below is a comparison of BKK revenues and expenses over the last 6 years (since the current opposition supported mayor holds office), where we can see that:
Total aid relatively consistently increased despite the recent disputes over funding with the government; this is mainly used for modernization, renovation and other development efforts, not plugging holes in the budget. This however also means that the BKK’s own capital is (mainly) not used for these purposes. This is relevant because it shows that possible holes are not plugged by specifically through external financial support.
Total transportation costs increased despite the new discounts and price decreases, which is offset partly by hiking all other non-pass ticket types (single ticket prices increased by 60% for example in the last ~5 years after being frozen for a decade before)
Total revenue taking a hit from 2020 and more sharply from 2021, but this period coincided with the Covid lockdowns, home office being the standard for most workplaces (for years) and thus less commuting. Tourism also plummeted in 2020-2021 though interestingly that didn’t seem to affect total transportation revenue for that year
Total revenue rebounding to positive for the first time in the last 6 years
But own capital decreasing steadily and losing a large chunk in 2021 - again coinciding with Covid and the new subsidies which suggests losses being offset by a loss of capital. This is something to keep an eye out for in the future, but the recent increase in transportation revenue and the positive closing balance doesn’t lead me to be alarmed of the financial health of the BKK.
Looking at other metrics, we can see a similar picture. Capital decreasing by 32%, but ROE rising to positive in 2024 for the first time in the period. The increasing debt ratio together with the decrease of capital also suggest increased costs needing to cover other expenses without overloading the budget. Coming out from the Covid period downturn and the new tariffs and discounts with a marginal increase of debt ratio (compared to just before Covid) is a good sign as there seems to be a lack severe adverse effects of discounted pass pricing where the beneficiaries are primarily the residents of the city.
As before, capital decreases might need to be addressed in due time if the trend continues.
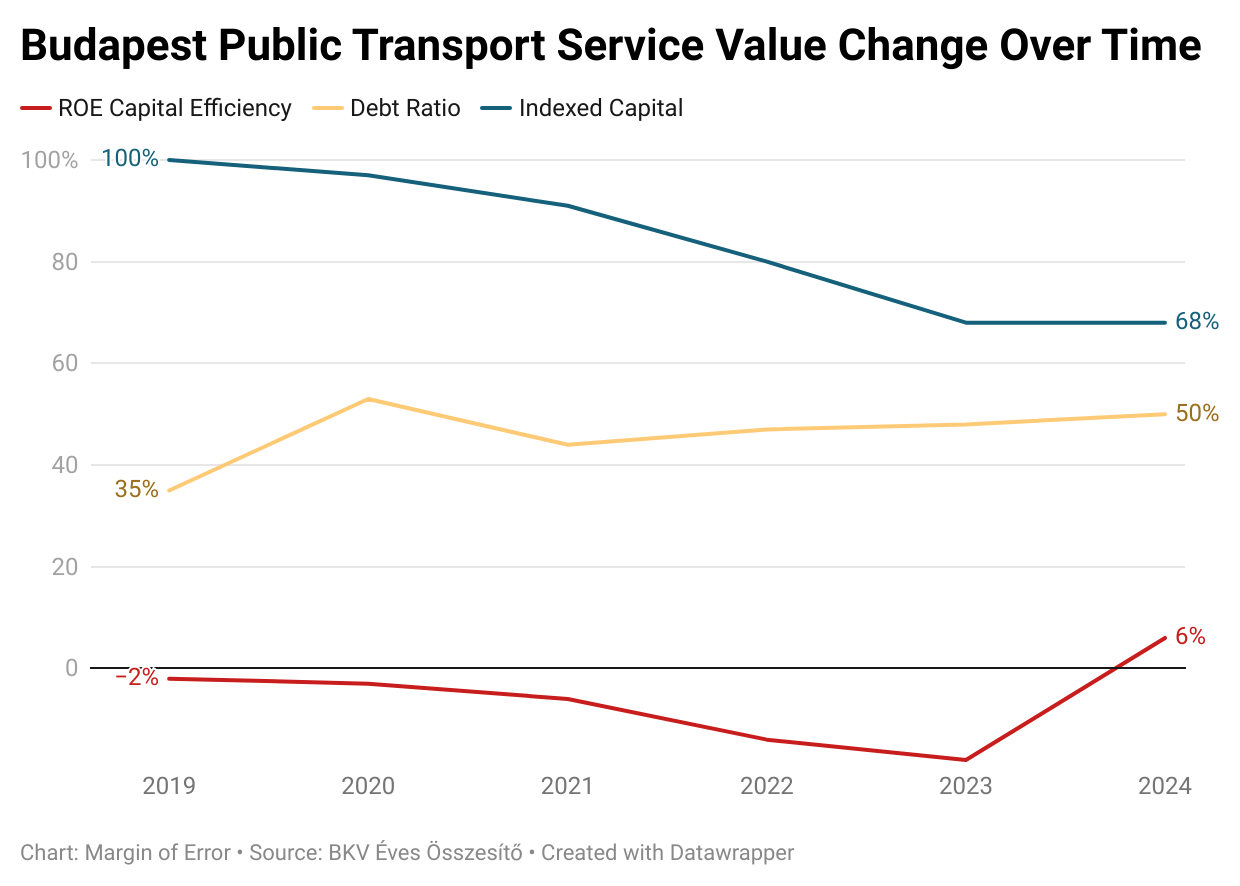
So newly discounted and in some cases downright free passes didn’t seem to leave a dent immediately in the profitability or revenues of the BKK, as the decreases mainly occurred during the Covid years. Since then both revenues and profitability have risen suggesting that these discounts are not detrimental to the BKK’s financial health. Capital decrease is, again, something to monitor but I wouldn’t relate that to the discounts/subsidies (as it’s mainly driven by amortization of assets, and personnel related costs as per the published yearly summaries) given the transportation revenues being constant or increasing.
Conclusion
Some of these comparisons of course are green apples to red apples. Every city is different, and naturally NY is a whole different dimension than Budapest or Dublin, with different means, different tools and different finances. They all face similar challenges though, out of control rent prices, inadequate amount of housing, and a call for cheaper public transport options. While the scale is obviously different, these stories from cities that are comparatively similar in their own countries to New York tell us that a radical 100% implementation of Mayor-Elect Mamdani’s policies is not a given, they might be (might have to be) watered down.
Overall however, they might just work if the commitment is there.